The Global Grid: Map Analysis
Data visualization on a global scale has evolved from a purely scientific tool into a form of digital art. Map Analysis explores the hidden beauty within the information flows that envelop our planet.
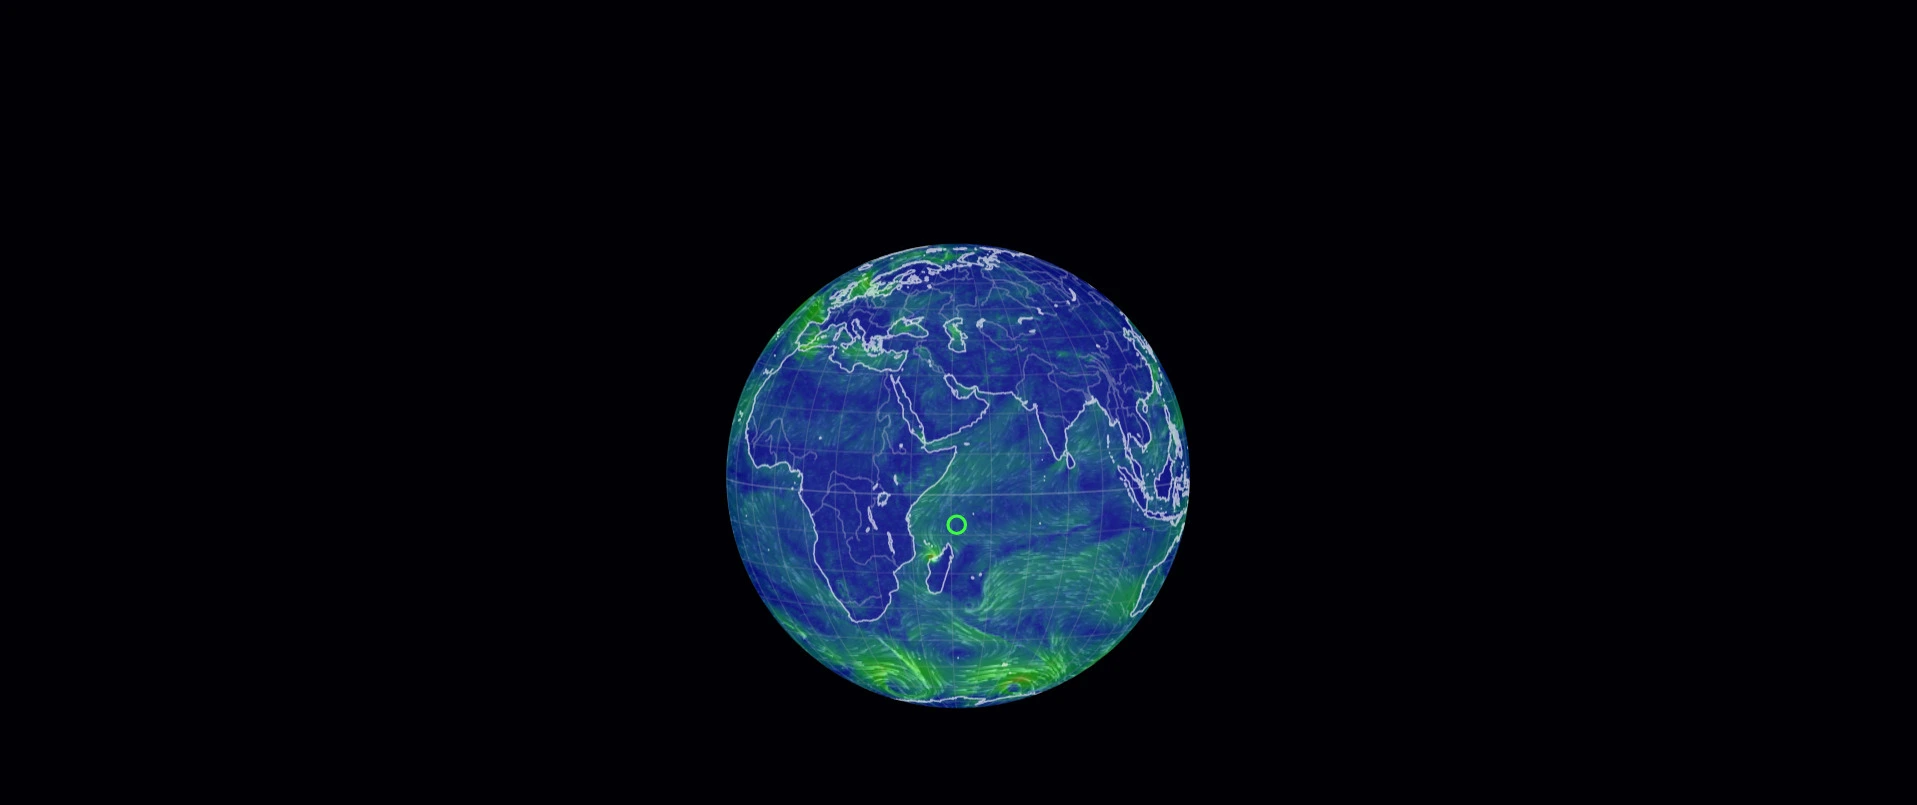
Dynamic Flow Visualization
This system utilizes real-time data to represent invisible phenomena. Whether it is wind patterns, network traffic, or ocean currents, the interface transforms abstract coordinates into a kinetic tapestry of particles moving according to real-world force vectors.
SYSTEM_ANALYSIS:
- Vector Field Rendering: Uses vector fields to define the direction and magnitude of each particle's movement.
- GRIB Data Processing: Weather or network data is processed from binary GRIB files into browser-readable formats (JSON/CSV).
- GPU Acceleration: The rendering relies on WebGL to handle thousands of simultaneous particles without degrading frame rates.
The Observer's Perspective
Within the PagesChaos archive, this map represents "Digital Omniscience." it grants us a satellite view of processes that normally escape human perception, turning global complexity into an aesthetic and understandable spectacle from a simple browser.